| All Measures - Anderson | PHQ-2 & GAD-2 - Anderson | Perceived Stress | Worry | |
|---|---|---|---|---|
| (1) | (2) | (3) | (4) | |
| coef | ||||
| Daily Mean Temperature | 0.0165*** (0.0042) |
0.0179*** (0.0044) |
0.0082* (0.0049) |
0.0087* (0.0048) |
| fe | ||||
| period | x | x | x | x |
| pid | x | x | x | x |
| stats | ||||
| Observations | 16,938 | 16,938 | 16,938 | 16,938 |
| R-squared | 0.386 | 0.312 | 0.261 | 0.294 |
| Significance levels: * p < 0.1, ** p < 0.05, *** p < 0.01. Format of coefficient cell: Coefficient (Std. Error) | ||||
May 7
Summary
- For the Ghana SES survey, I couldn’t find a way to find geographic coordinates more precise than the district level. Temperature at the district is fairly imprecise so not sure if it is a meaningful measurement
- In Bangalore, we wanted to confirm that the null result is well measured: the result is consistent for people who experience really hot weather and across those who experience a large range of temperature. However, overall experience of temperature ranges is less than in Ghana.
- I used DHS data in 3 countries where we have PHQ, GAD: Bangladesh, Mozambique and Nepal. We see almost 0 impact of temperature.
- Note: data is not a panel so we are comparing people within a DHS cluster
From Last Time
Temperature seems to affect mental health in Ghana but not in Bangalore. Existing papers show some impact on mental health so it is strange that we found a precise null in Bangalore. Additionally, the results conflicts with what we see in Ghana.
To explore these further, we are looking to:
- Understand channel for how temperature affects mental health
- Rule out measurement issues in Bangalore data
| All Measures - Anderson | PHQ + GAD - Anderson | Loneliness - Z-score | Depression - Z-score | |
|---|---|---|---|---|
| (1) | (2) | (3) | (4) | |
| coef | ||||
| Daily Mean Temperature | 0.0024 (0.0048) |
0.0037 (0.0047) |
-0.0009 (0.0019) |
0.0013 (0.0022) |
| fe | ||||
| month | x | x | x | x |
| pid | x | x | x | x |
| stats | ||||
| Observations | 6,038 | 6,043 | 6,047 | 6,047 |
| R-squared | 0.651 | 0.648 | 0.589 | 0.636 |
| Significance levels: * p < 0.1, ** p < 0.05, *** p < 0.01. Format of coefficient cell: Coefficient (Std. Error) | ||||
Quick
Ghana SES data
We considered using Ghana SES survey to dig deeper into agricultural channel and explore some of the seasonality in mental health. This helps us nail farming as a channel and address correlation between temperature and lean season given that the mental health shows empirical patterns tied to agricultural seasonality.
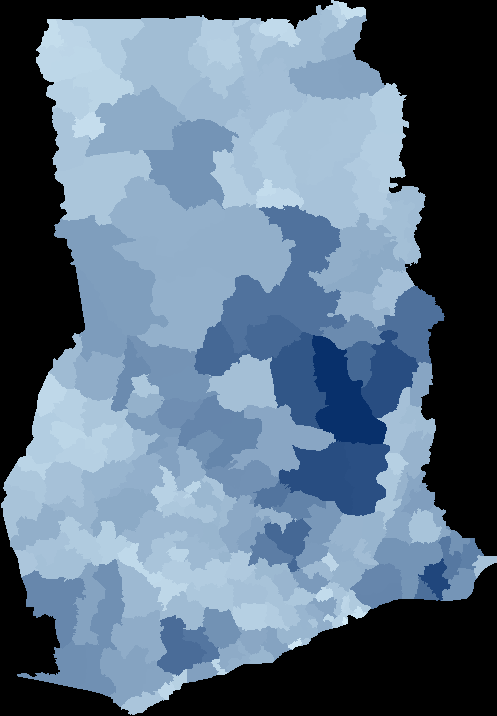
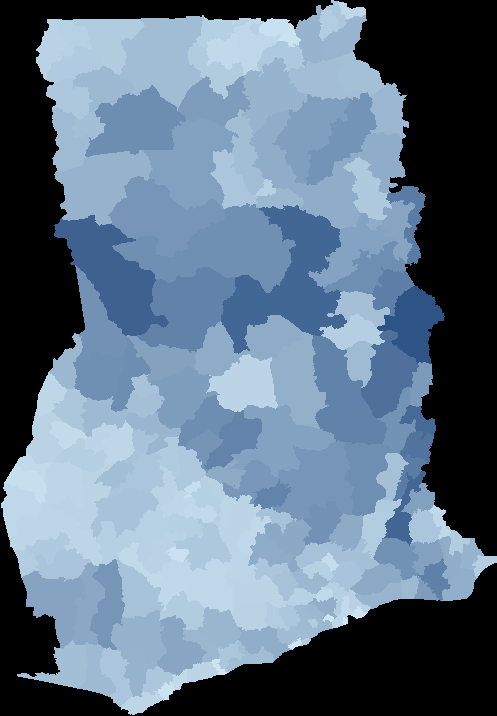
- We do not have coordinates for the enumeration areas. Finest level of data I could find is district level but it seems districts are quite hetregenous in temperatures
Using district level temperature data seems noisy given the large variation in temperatures within districts. Below are maps showing the temperature variation within a single district and single hour based on satellite data. In some districts, the variation is pretty large, close to 10 C, which makes me think that using temperature data at the district level is too noisy.
Bangalore - Measurement
In Bangalore, we wanted to make sure the null result is not driven by measurement error. As a first check, below show results for a subsample of people who experience hot temperatures (>84F or 29C) and experience a large variance (>10F or >15F).
The first two subsample show no heterogeneity from the main results. The Range >15 subsample seems to have notably different coefficients for PHQ-GAD anderson, but the N is fairly small at 486.
| All Measures - Anderson | PHQ + GAD - Anderson | Loneliness - Z-score | Depression - Z-score | |
|---|---|---|---|---|
| (1) | (2) | (3) | (4) | |
| coef | ||||
| Daily Mean Temperature | -0.0094 (0.0083) |
0.0001 (0.0082) |
-0.0062* (0.0034) |
-0.0005 (0.0038) |
| fe | ||||
| month | x | x | x | x |
| pid | x | x | x | x |
| stats | ||||
| Observations | 1,154 | 1,156 | 1,156 | 1,156 |
| R-squared | 0.668 | 0.637 | 0.623 | 0.615 |
| Significance levels: * p < 0.1, ** p < 0.05, *** p < 0.01. Format of coefficient cell: Coefficient (Std. Error) | ||||
| All Measures - Anderson | PHQ + GAD - Anderson | Loneliness - Z-score | Depression - Z-score | |
|---|---|---|---|---|
| (1) | (2) | (3) | (4) | |
| coef | ||||
| Daily Mean Temperature | -0.0016 (0.0062) |
0.0015 (0.0062) |
-0.0028 (0.0026) |
0.0019 (0.0028) |
| fe | ||||
| month | x | x | x | x |
| pid | x | x | x | x |
| stats | ||||
| Observations | 2,403 | 2,406 | 2,407 | 2,407 |
| R-squared | 0.651 | 0.65 | 0.575 | 0.633 |
| Significance levels: * p < 0.1, ** p < 0.05, *** p < 0.01. Format of coefficient cell: Coefficient (Std. Error) | ||||
| All Measures - Anderson | PHQ + GAD - Anderson | Loneliness - Z-score | Depression - Z-score | |
|---|---|---|---|---|
| (1) | (2) | (3) | (4) | |
| coef | ||||
| Daily Mean Temperature | -0.0152 (0.0136) |
-0.0128 (0.0138) |
-0.0031 (0.0052) |
-0.0028 (0.0064) |
| fe | ||||
| month | x | x | x | x |
| pid | x | x | x | x |
| stats | ||||
| Observations | 486 | 487 | 487 | 487 |
| R-squared | 0.642 | 0.601 | 0.666 | 0.59 |
| Significance levels: * p < 0.1, ** p < 0.05, *** p < 0.01. Format of coefficient cell: Coefficient (Std. Error) | ||||
However, the people in Ghana do experience more temperature variation in the data; a much higher proportion of people experience more than 10F compared to our sample in Bangalore.
| Sample | Number individuals who experience above 84F | Average range experience by individuals | % who experience above 5F range | % who experience above 10F range | % who experience above 15F range |
|---|---|---|---|---|---|
| Bangalore | 199 | 8.2F | 74.7% | 34.8% | 6.6% |
| Ghana | 2160 | 11.2F | 99.8% | 71.4% | 4.9% |
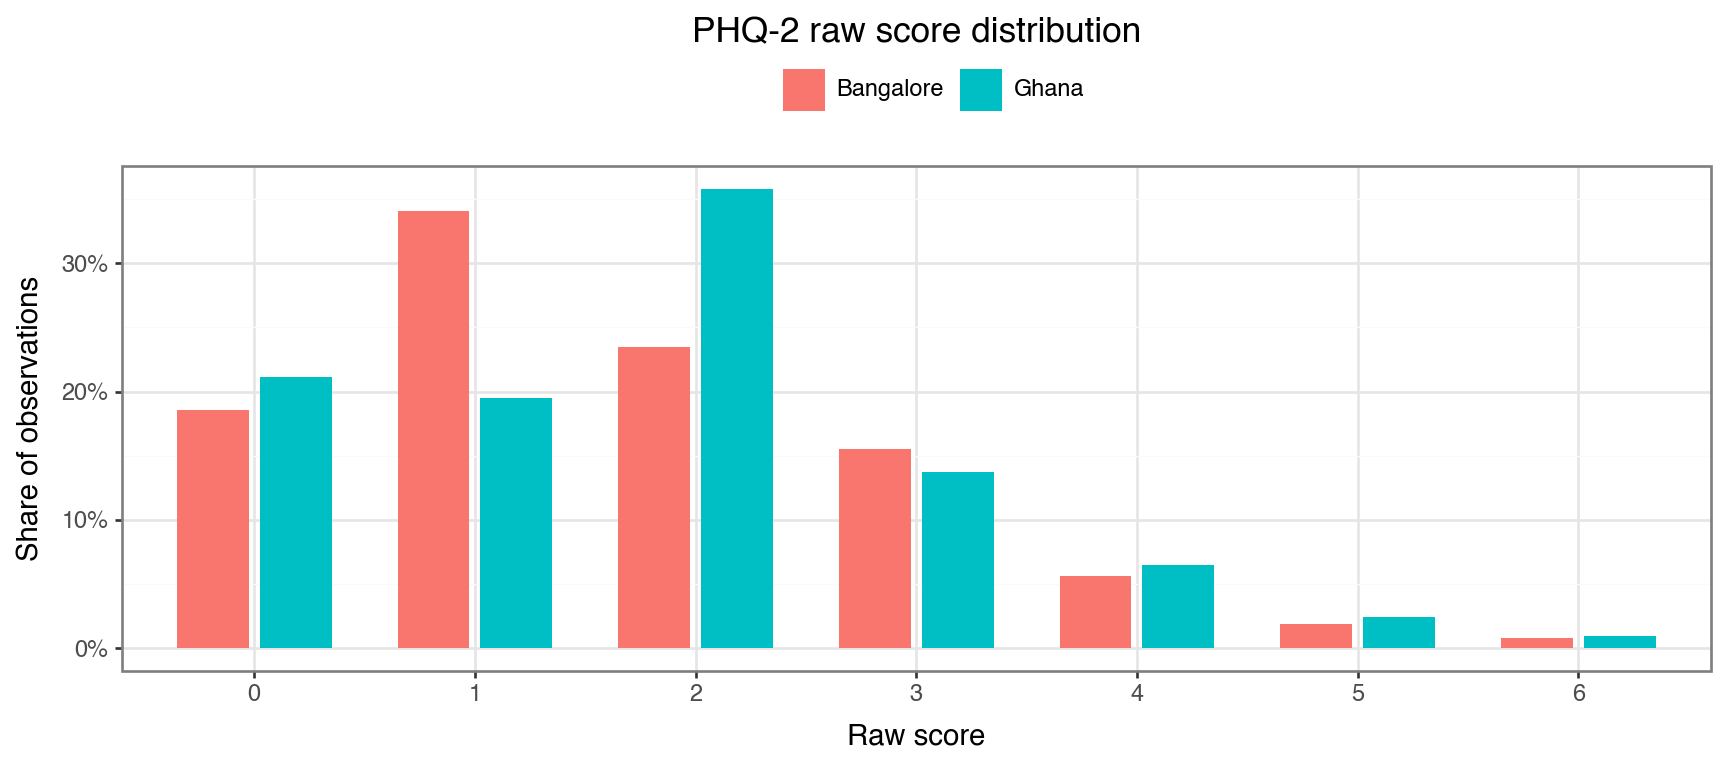
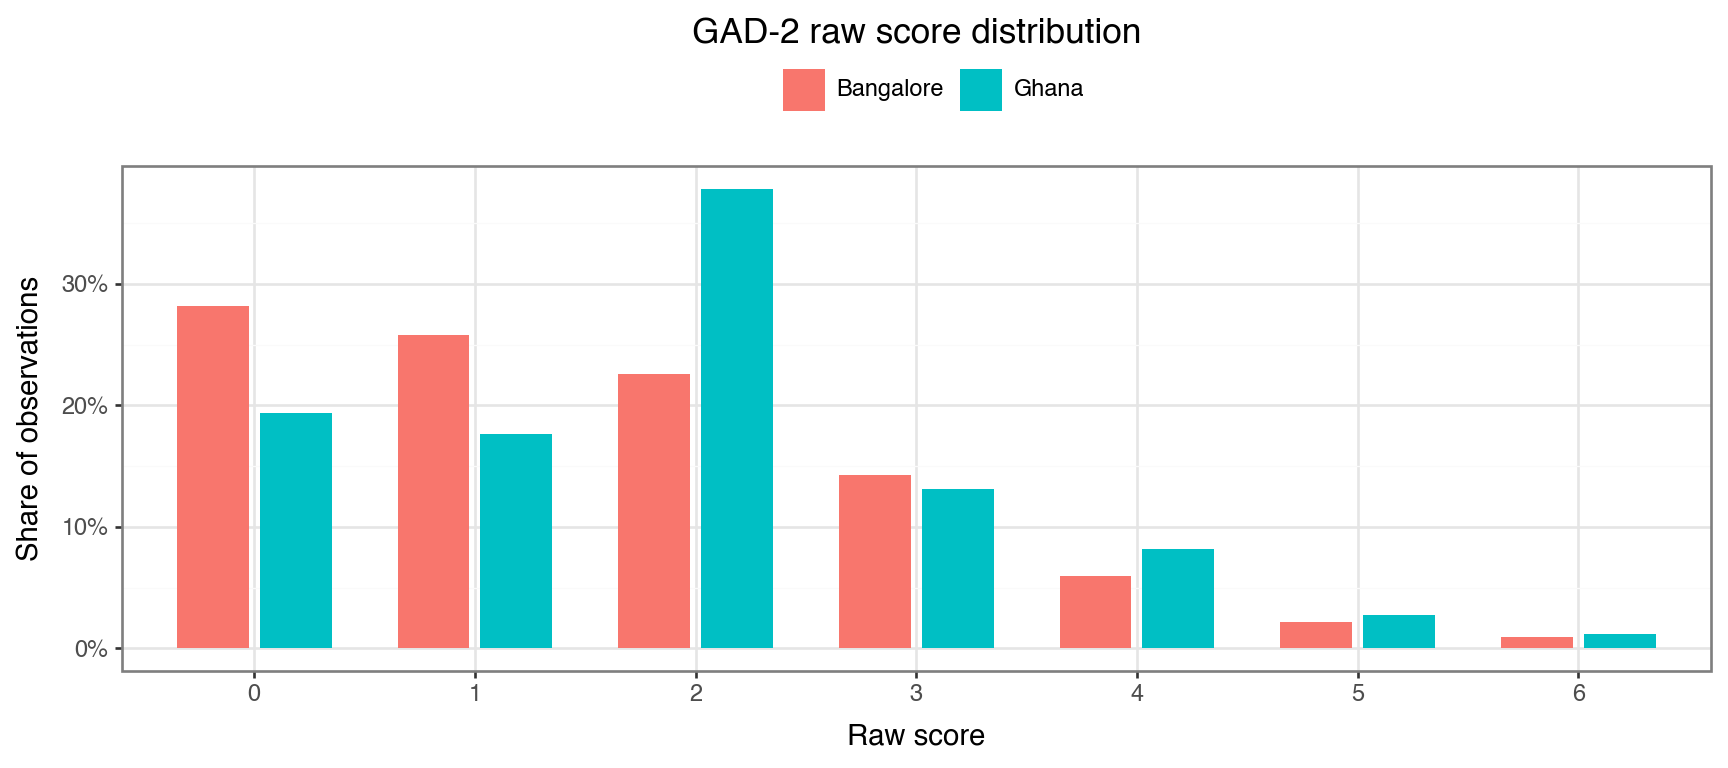
Raw mental health score distributions
The Bangalore null may be partly about the longer frame between measurements. Below, the Bangalore raw PHQ-2 and GAD-2 score distributions are shown next to the Ghana short-form scores.
Distribution of raw scores
DHS
The DHS surveys give us a broader cross-country comparison using Bangladesh, Mozambique, and Nepal. Outcomes are standardized within country; the main specification uses country-cluster fixed effects and daily mean temperature.
Temperature Exposure
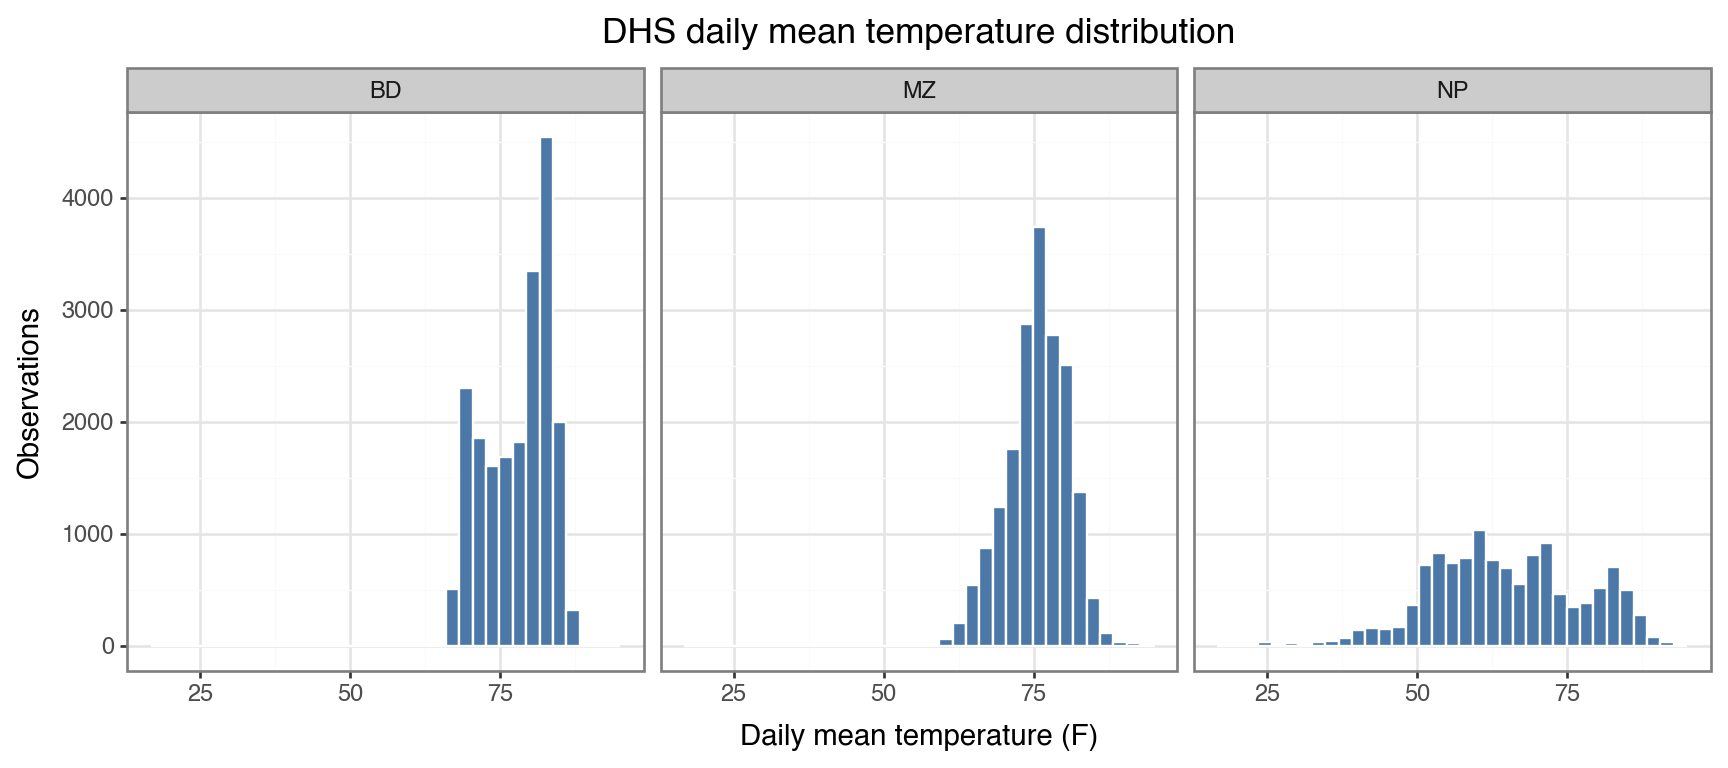
| Sample | Individuals above 84F | Average range experienced | % above 5F range | % above 10F range | % above 15F range |
|---|---|---|---|---|---|
| All Countries | 27961 | 17.4F | 99.1% | 90.5% | 62.2% |
| Bangladesh | 13367 | 14.9F | 98.2% | 83.5% | 43.1% |
| Mozambique | 11283 | 18.5F | 99.6% | 92.9% | 70.2% |
| Nepal | 3311 | 19.7F | 100.0% | 98.2% | 81.1% |
| Sample | Average observations per cluster | Mean date range in cluster | Max date range in cluster |
|---|---|---|---|
| All Countries | 28.8 | 4.4 days | 175.0 days |
| Bangladesh | 29.7 | 2.0 days | 41.0 days |
| Mozambique | 30.1 | 7.5 days | 175.0 days |
| Nepal | 26.0 | 3.6 days | 23.0 days |
Regressions
| PHQ - Z-score | GAD - Z-score | PHQ - GAD Anderson | |
|---|---|---|---|
| (1) | (2) | (3) | |
| coef | |||
| Daily Mean Temperature | 0.0000 (0.0031) |
-0.0007 (0.0032) |
-0.0004 (0.0031) |
| fe | |||
| Country-cluster FE | x | x | x |
| stats | |||
| Observations | 50,905 | 50,905 | 50,905 |
| R-squared | 0.143 | 0.14 | 0.154 |
| Significance levels: * p < 0.1, ** p < 0.05, *** p < 0.01. Format of coefficient cell: Coefficient (Std. Error) | |||
| PHQ - Z-score | GAD - Z-score | PHQ - GAD Anderson | |
|---|---|---|---|
| (1) | (2) | (3) | |
| coef | |||
| Daily Mean Temperature | -0.0010* (0.0006) |
-0.0028*** (0.0006) |
-0.0020*** (0.0006) |
| fe | |||
| Country FE | x | x | x |
| stats | |||
| Observations | 50,905 | 50,905 | 50,905 |
| R-squared | 0.000055 | 0.000464 | 0.000242 |
| Significance levels: * p < 0.1, ** p < 0.05, *** p < 0.01. Format of coefficient cell: Coefficient (Std. Error) | |||
Bangladesh
| PHQ - Z-score | GAD - Z-score | PHQ - GAD Anderson | |
|---|---|---|---|
| (1) | (2) | (3) | |
| coef | |||
| Daily Mean Temperature | -0.0013 (0.0081) |
0.0008 (0.0082) |
-0.0003 (0.0080) |
| fe | |||
| Cluster FE | x | x | x |
| stats | |||
| Observations | 19,987 | 19,987 | 19,987 |
| R-squared | 0.148 | 0.137 | 0.156 |
| Significance levels: * p < 0.1, ** p < 0.05, *** p < 0.01. Format of coefficient cell: Coefficient (Std. Error) | |||
Mozambique
| PHQ - Z-score | GAD - Z-score | PHQ - GAD Anderson | |
|---|---|---|---|
| (1) | (2) | (3) | |
| coef | |||
| Daily Mean Temperature | 0.0040 (0.0040) |
0.0001 (0.0040) |
0.0022 (0.0040) |
| fe | |||
| Cluster FE | x | x | x |
| stats | |||
| Observations | 18,563 | 18,563 | 18,563 |
| R-squared | 0.159 | 0.165 | 0.176 |
| Significance levels: * p < 0.1, ** p < 0.05, *** p < 0.01. Format of coefficient cell: Coefficient (Std. Error) | |||
Nepal
| PHQ - Z-score | GAD - Z-score | PHQ - GAD Anderson | |
|---|---|---|---|
| (1) | (2) | (3) | |
| coef | |||
| Daily Mean Temperature | -0.0089 (0.0064) |
-0.0038 (0.0064) |
-0.0068 (0.0065) |
| fe | |||
| Cluster FE | x | x | x |
| stats | |||
| Observations | 12,355 | 12,355 | 12,355 |
| R-squared | 0.111 | 0.108 | 0.117 |
| Significance levels: * p < 0.1, ** p < 0.05, *** p < 0.01. Format of coefficient cell: Coefficient (Std. Error) | |||
| PHQ - Z-score | GAD - Z-score | PHQ - GAD Anderson | |
|---|---|---|---|
| (1) | (2) | (3) | |
| coef | |||
| Daily Mean Temperature | -0.0494** (0.0219) |
-0.0175 (0.0219) |
-0.0359* (0.0217) |
| Daily Mean Temperature Squared | 0.0003** (0.0002) |
0.0001 (0.0002) |
0.0002* (0.0002) |
| fe | |||
| Country-cluster FE | x | x | x |
| stats | |||
| Observations | 50,905 | 50,905 | 50,905 |
| R-squared | 0.143 | 0.14 | 0.154 |
| Significance levels: * p < 0.1, ** p < 0.05, *** p < 0.01. Format of coefficient cell: Coefficient (Std. Error) | |||
| PHQ - Z-score | GAD - Z-score | PHQ - GAD Anderson | PHQ - Z-score | GAD - Z-score | PHQ - GAD Anderson | PHQ - Z-score | GAD - Z-score | PHQ - GAD Anderson | PHQ - Z-score | GAD - Z-score | PHQ - GAD Anderson | |
|---|---|---|---|---|---|---|---|---|---|---|---|---|
| (1) | (2) | (3) | (4) | (5) | (6) | (7) | (8) | (9) | (10) | (11) | (12) | |
| coef | ||||||||||||
| Minimum Sleep Temperature Above 70F | -0.0032 (0.0061) |
-0.0063 (0.0061) |
-0.0051 (0.0060) |
|||||||||
| Maximum Sleep Temperature Above 70F | 0.0011 (0.0027) |
0.0003 (0.0027) |
0.0007 (0.0027) |
|||||||||
| Daily Mean Temperature Above 84F | -0.0025 (0.0180) |
-0.0136 (0.0180) |
-0.0087 (0.0179) |
|||||||||
| Daily Maximum Temperature Above 84F | 0.0036 (0.0030) |
0.0003 (0.0030) |
0.0021 (0.0029) |
|||||||||
| fe | ||||||||||||
| Country-cluster FE | x | x | x | x | x | x | x | x | x | x | x | x |
| stats | ||||||||||||
| Observations | 50,905 | 50,905 | 50,905 | 50,905 | 50,905 | 50,905 | 50,905 | 50,905 | 50,905 | 50,905 | 50,905 | 50,905 |
| R-squared | 0.143 | 0.14 | 0.154 | 0.143 | 0.14 | 0.154 | 0.143 | 0.14 | 0.154 | 0.143 | 0.14 | 0.154 |
| Significance levels: * p < 0.1, ** p < 0.05, *** p < 0.01. Format of coefficient cell: Coefficient (Std. Error) | ||||||||||||
| PHQ - Z-score | GAD - Z-score | PHQ - GAD Anderson | PHQ - Z-score | GAD - Z-score | PHQ - GAD Anderson | PHQ - Z-score | GAD - Z-score | PHQ - GAD Anderson | PHQ - Z-score | GAD - Z-score | PHQ - GAD Anderson | |
|---|---|---|---|---|---|---|---|---|---|---|---|---|
| (1) | (2) | (3) | (4) | (5) | (6) | (7) | (8) | (9) | (10) | (11) | (12) | |
| coef | ||||||||||||
| Daily Maximum Temperature | 0.0003 (0.0019) |
0.0002 (0.0019) |
0.0003 (0.0019) |
|||||||||
| Minimum Sleep Temperature | -0.0008 (0.0025) |
-0.0017 (0.0025) |
-0.0013 (0.0025) |
|||||||||
| Past 2 Weeks Mean Temperature | -0.0186* (0.0110) |
-0.0116 (0.0110) |
-0.0162 (0.0109) |
|||||||||
| Past Month Mean Temperature | -0.0171 (0.0122) |
0.0017 (0.0122) |
-0.0083 (0.0121) |
|||||||||
| fe | ||||||||||||
| Country-cluster FE | x | x | x | x | x | x | x | x | x | x | x | x |
| stats | ||||||||||||
| Observations | 50,905 | 50,905 | 50,905 | 50,905 | 50,905 | 50,905 | 50,905 | 50,905 | 50,905 | 50,905 | 50,905 | 50,905 |
| R-squared | 0.143 | 0.14 | 0.154 | 0.143 | 0.14 | 0.154 | 0.143 | 0.14 | 0.154 | 0.143 | 0.14 | 0.154 |
| Significance levels: * p < 0.1, ** p < 0.05, *** p < 0.01. Format of coefficient cell: Coefficient (Std. Error) | ||||||||||||
| PHQ - Z-score | GAD - Z-score | PHQ - GAD Anderson | |
|---|---|---|---|
| (1) | (2) | (3) | |
| coef | |||
| Daily Mean Temperature | 0.0037 (0.0066) |
-0.0024 (0.0067) |
0.0007 (0.0066) |
| fe | |||
| Country-cluster FE | x | x | x |
| stats | |||
| Observations | 13,161 | 13,161 | 13,161 |
| R-squared | 0.208 | 0.208 | 0.217 |
| Significance levels: * p < 0.1, ** p < 0.05, *** p < 0.01. Format of coefficient cell: Coefficient (Std. Error) | |||
| PHQ - Z-score | GAD - Z-score | PHQ - GAD Anderson | |
|---|---|---|---|
| (1) | (2) | (3) | |
| coef | |||
| Daily Mean Temperature | 0.0002 (0.0036) |
0.0017 (0.0036) |
0.0010 (0.0036) |
| fe | |||
| Country-cluster FE | x | x | x |
| stats | |||
| Observations | 37,744 | 37,744 | 37,744 |
| R-squared | 0.172 | 0.167 | 0.184 |
| Significance levels: * p < 0.1, ** p < 0.05, *** p < 0.01. Format of coefficient cell: Coefficient (Std. Error) | |||