| All Measures - Anderson | PHQ + GAD - Anderson | Loneliness - Z-score | Depression - Z-score | |
|---|---|---|---|---|
| (1) | (2) | (3) | (4) | |
| coef | ||||
| Daily Mean Temperature | 0.002 (0.005) |
0.004 (0.005) |
-0.001 (0.002) |
0.001 (0.002) |
| fe | ||||
| month | x | x | x | x |
| pid | x | x | x | x |
| stats | ||||
| Observations | 6,038 | 6,043 | 6,047 | 6,047 |
| R-squared | 0.651 | 0.648 | 0.589 | 0.636 |
| Significance levels: * p < 0.1, ** p < 0.05, *** p < 0.01. Format of coefficient cell: Coefficient (Std. Error) | ||||
Initial Results
Key Findings
- Some explanations for the difference in results across the two contexts:
- Temperatures in Ghana are hotter than what we observe in Bangalore
- We are simply picking up on the seasonality of mental health we observed in Ghana. Temperatures are declining as we move into the lean season which coincides with the improvement in Mental Health we observe in the data
- Measurement timing.
- Difference 1: In Bangalore we have 4 measurements two weeks apart and then another 2 measurements that are 2 months apart. Other within person variations are likely to occur in that time frame, drowning the impact of temperature
- Difference 2: The Bangalore study occurs over a much larger time frame; from Jan 25, 2023 to Dec 11, 2024. The ghana measurments are all within May - Sept. 2025
Main Results
- No impact of temperature on mental health in bangalore
- We see an impact in Ghana
Caution
Ghana regressions use the short-form scale. In the Bangalore data, we have long-form data which is what the regressions are run on.
Robustness
Note: the results are robust to: - Excluding in-person data from the ghana regressions - Robust to different temperature measures
| All Measures - Anderson | PHQ-2 & GAD-2 - Anderson | Perceived Stress | Worry | |
|---|---|---|---|---|
| (1) | (2) | (3) | (4) | |
| coef | ||||
| Daily Mean Temperature | 0.017*** (0.004) |
0.018*** (0.004) |
0.008* (0.005) |
0.009* (0.005) |
| fe | ||||
| period | x | x | x | x |
| pid | x | x | x | x |
| stats | ||||
| Observations | 16,938 | 16,938 | 16,938 | 16,938 |
| R-squared | 0.386 | 0.312 | 0.261 | 0.294 |
| Significance levels: * p < 0.1, ** p < 0.05, *** p < 0.01. Format of coefficient cell: Coefficient (Std. Error) | ||||
Bangalore Subset
| All Measures - Anderson | PHQ + GAD - Anderson | Loneliness - Z-score | Depression - Z-score | |
|---|---|---|---|---|
| (1) | (2) | (3) | (4) | |
| coef | ||||
| Daily Mean Temperature | -0.009 (0.008) |
0.000 (0.008) |
-0.006* (0.003) |
-0.000 (0.004) |
| fe | ||||
| month | x | x | x | x |
| pid | x | x | x | x |
| stats | ||||
| Observations | 1,154 | 1,156 | 1,156 | 1,156 |
| R-squared | 0.668 | 0.637 | 0.623 | 0.615 |
| Significance levels: * p < 0.1, ** p < 0.05, *** p < 0.01. Format of coefficient cell: Coefficient (Std. Error) | ||||
| All Measures - Anderson | PHQ + GAD - Anderson | Loneliness - Z-score | Depression - Z-score | |
|---|---|---|---|---|
| (1) | (2) | (3) | (4) | |
| coef | ||||
| Daily Mean Temperature | -0.002 (0.006) |
0.002 (0.006) |
-0.003 (0.003) |
0.002 (0.003) |
| fe | ||||
| month | x | x | x | x |
| pid | x | x | x | x |
| stats | ||||
| Observations | 2,403 | 2,406 | 2,407 | 2,407 |
| R-squared | 0.651 | 0.65 | 0.575 | 0.633 |
| Significance levels: * p < 0.1, ** p < 0.05, *** p < 0.01. Format of coefficient cell: Coefficient (Std. Error) | ||||
| All Measures - Anderson | PHQ + GAD - Anderson | Loneliness - Z-score | Depression - Z-score | |
|---|---|---|---|---|
| (1) | (2) | (3) | (4) | |
| coef | ||||
| Daily Mean Temperature | -0.015 (0.014) |
-0.013 (0.014) |
-0.003 (0.005) |
-0.003 (0.006) |
| fe | ||||
| month | x | x | x | x |
| pid | x | x | x | x |
| stats | ||||
| Observations | 486 | 487 | 487 | 487 |
| R-squared | 0.642 | 0.601 | 0.666 | 0.59 |
| Significance levels: * p < 0.1, ** p < 0.05, *** p < 0.01. Format of coefficient cell: Coefficient (Std. Error) | ||||
Data
Temperature
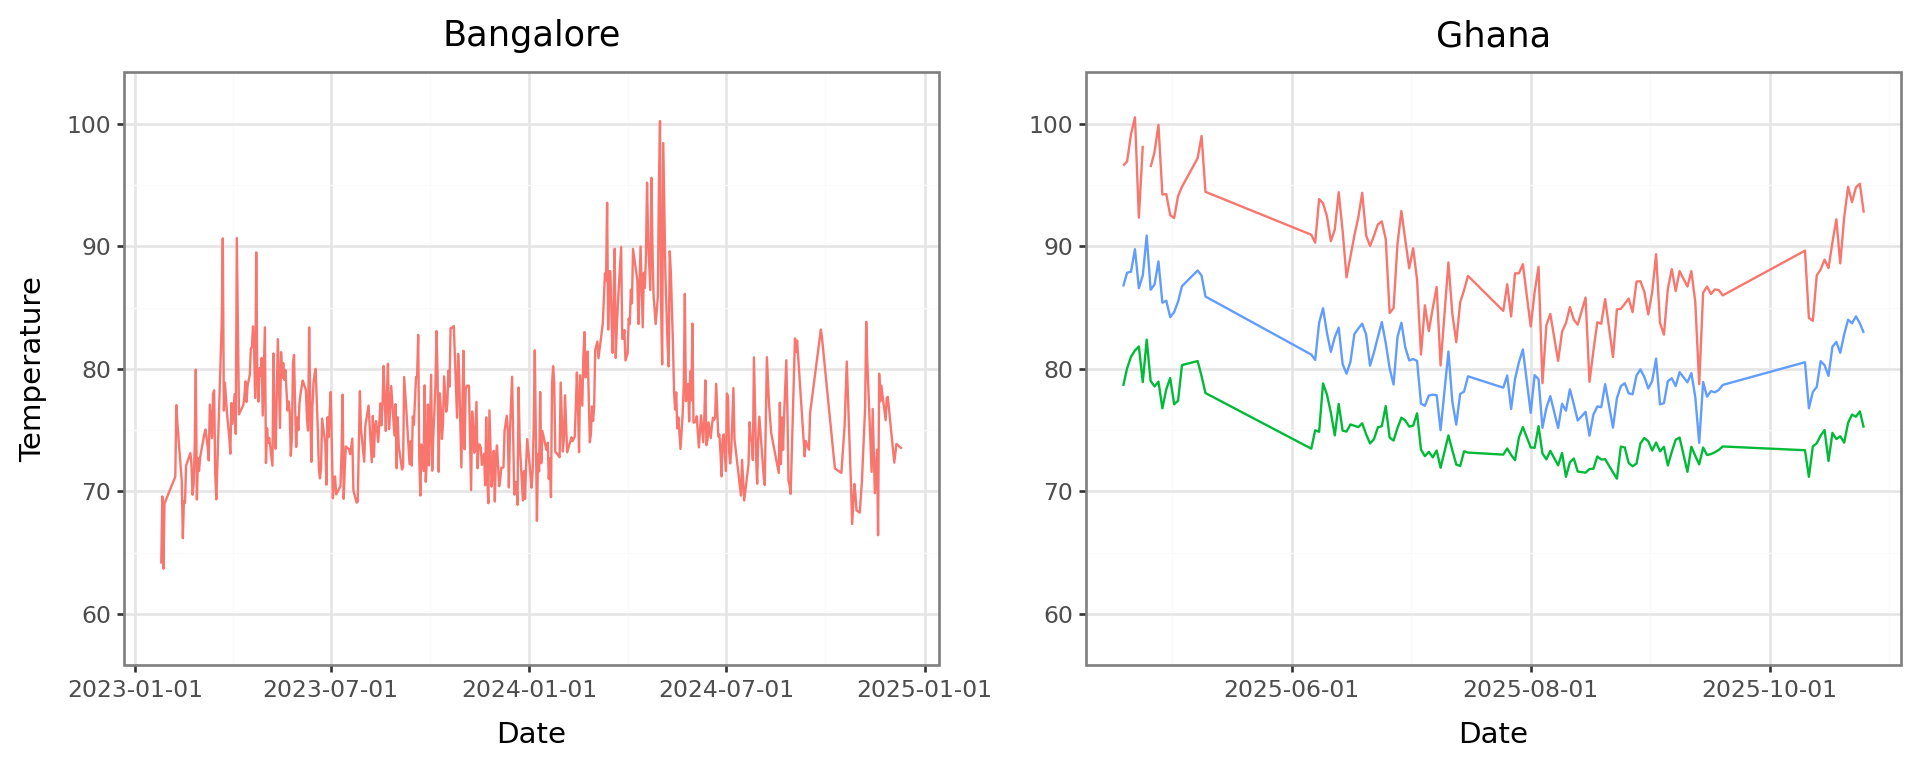
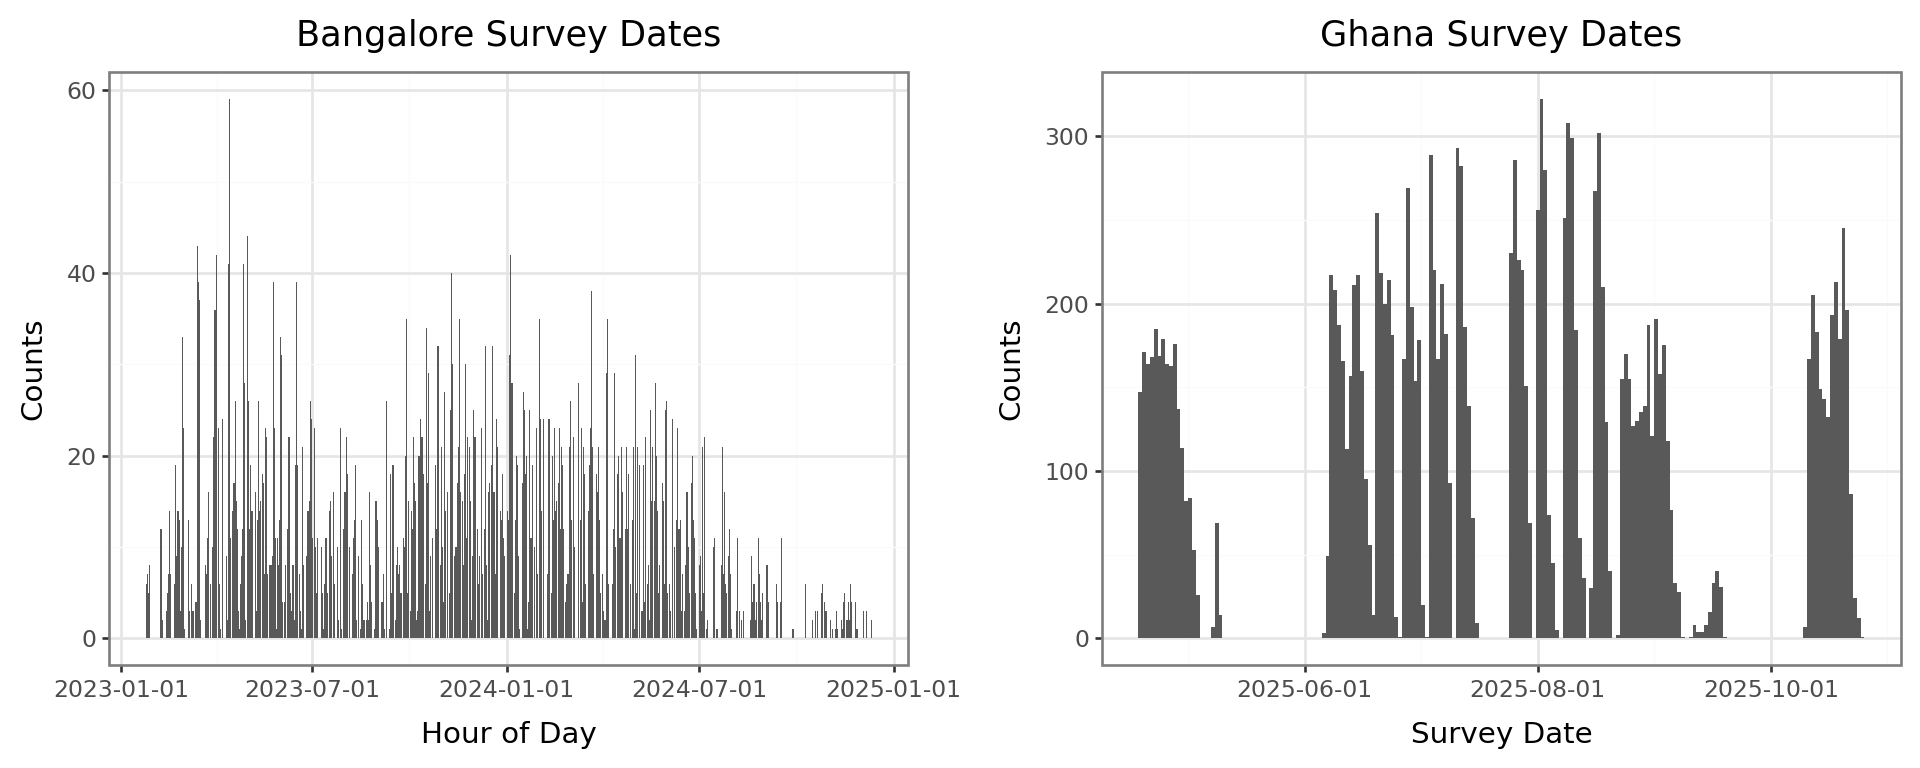
Survey Timing
The Bangalore study occurs over a much larger time frame; from Jan 25, 2023 to Dec 11, 2024. The ghana measurments are all within May - Sept. 2025. In Bangalore, we observe people across a larger range of temperatures and seasons
Appendix
Main Result Robustness
Excluding in-person data in Ghana
Ghana results are robust to only using survey data and excluding endline / baseline data
| All Measures - Anderson | PHQ-2 & GAD-2 - Anderson | Perceived Stress | Worry | |
|---|---|---|---|---|
| (1) | (2) | (3) | (4) | |
| coef | ||||
| Daily Mean Temperature | 0.025*** (0.006) |
0.028*** (0.006) |
0.008 (0.007) |
0.007 (0.007) |
| fe | ||||
| period | x | x | x | x |
| pid | x | x | x | x |
| stats | ||||
| Observations | 10,345 | 10,345 | 10,345 | 10,345 |
| R-squared | 0.488 | 0.399 | 0.387 | 0.387 |
| Significance levels: * p < 0.1, ** p < 0.05, *** p < 0.01. Format of coefficient cell: Coefficient (Std. Error) | ||||
Using Daily Maximum Temperature
Daily Maximum Temperature
| All Measures - Anderson | PHQ + GAD - Anderson | Loneliness - Z-score | Depression - Z-score | |
|---|---|---|---|---|
| (1) | (2) | (3) | (4) | |
| coef | ||||
| Daily Maximum Temperature | 0.001 (0.003) |
0.001 (0.003) |
-0.000 (0.001) |
0.000 (0.001) |
| fe | ||||
| month | x | x | x | x |
| pid | x | x | x | x |
| stats | ||||
| Observations | 6,038 | 6,043 | 6,047 | 6,047 |
| R-squared | 0.651 | 0.648 | 0.589 | 0.636 |
| Significance levels: * p < 0.1, ** p < 0.05, *** p < 0.01. Format of coefficient cell: Coefficient (Std. Error) | ||||
Hourly Temperature
| All Measures - Anderson | PHQ + GAD - Anderson | Loneliness - Z-score | Depression - Z-score | All Measures - Anderson | PHQ + GAD - Anderson | Loneliness - Z-score | Depression - Z-score | |
|---|---|---|---|---|---|---|---|---|
| (1) | (2) | (3) | (4) | (5) | (6) | (7) | (8) | |
| coef | ||||||||
| Hourly Temperature | -0.002 (0.002) |
-0.001 (0.002) |
-0.001* (0.001) |
0.000 (0.001) |
||||
| Hourly Apparent Temperature | -0.003 (0.002) |
-0.001 (0.002) |
-0.001* (0.001) |
-0.000 (0.001) |
||||
| fe | ||||||||
| month | x | x | x | x | x | x | x | x |
| pid | x | x | x | x | x | x | x | x |
| stats | ||||||||
| Observations | 6,038 | 6,043 | 6,047 | 6,047 | 6,038 | 6,043 | 6,047 | 6,047 |
| R-squared | 0.651 | 0.648 | 0.589 | 0.636 | 0.651 | 0.648 | 0.59 | 0.636 |
| Significance levels: * p < 0.1, ** p < 0.05, *** p < 0.01. Format of coefficient cell: Coefficient (Std. Error) | ||||||||
Past Temperatures
| All Measures - Anderson | PHQ + GAD - Anderson | Loneliness - Z-score | Depression - Z-score | All Measures - Anderson | PHQ + GAD - Anderson | Loneliness - Z-score | Depression - Z-score | |
|---|---|---|---|---|---|---|---|---|
| (1) | (2) | (3) | (4) | (5) | (6) | (7) | (8) | |
| coef | ||||||||
| Past 2 Weeks Mean Temperature | -0.003 (0.006) |
0.000 (0.005) |
-0.002 (0.002) |
0.002 (0.003) |
||||
| Past Month Mean Temperature | 0.003 (0.007) |
0.007 (0.007) |
-0.001 (0.003) |
0.006* (0.003) |
||||
| fe | ||||||||
| month | x | x | x | x | x | x | x | x |
| pid | x | x | x | x | x | x | x | x |
| stats | ||||||||
| Observations | 6,038 | 6,043 | 6,047 | 6,047 | 6,038 | 6,043 | 6,047 | 6,047 |
| R-squared | 0.651 | 0.648 | 0.589 | 0.636 | 0.651 | 0.648 | 0.589 | 0.636 |
| Significance levels: * p < 0.1, ** p < 0.05, *** p < 0.01. Format of coefficient cell: Coefficient (Std. Error) | ||||||||
Daily Max
| All Measures - Anderson | PHQ-2 & GAD-2 - Anderson | Perceived Stress | Worry | |
|---|---|---|---|---|
| (1) | (2) | (3) | (4) | |
| coef | ||||
| Daily Maximum Temperature | 0.012*** (0.003) |
0.011*** (0.003) |
0.006* (0.003) |
0.006* (0.003) |
| fe | ||||
| period | x | x | x | x |
| pid | x | x | x | x |
| stats | ||||
| Observations | 16,938 | 16,938 | 16,938 | 16,938 |
| R-squared | 0.387 | 0.312 | 0.261 | 0.294 |
| Significance levels: * p < 0.1, ** p < 0.05, *** p < 0.01. Format of coefficient cell: Coefficient (Std. Error) | ||||
Past Temperatures
| All Measures - Anderson | PHQ-2 & GAD-2 - Anderson | Perceived Stress | Worry | All Measures - Anderson | PHQ-2 & GAD-2 - Anderson | Perceived Stress | Worry | |
|---|---|---|---|---|---|---|---|---|
| (1) | (2) | (3) | (4) | (5) | (6) | (7) | (8) | |
| coef | ||||||||
| Past 2 Weeks Mean Temperature | 0.020* (0.011) |
0.004 (0.011) |
0.037*** (0.013) |
0.024** (0.012) |
||||
| Past Month Mean Temperature | 0.021 (0.015) |
0.011 (0.015) |
0.061*** (0.017) |
0.030* (0.017) |
||||
| fe | ||||||||
| period | x | x | x | x | x | x | x | x |
| pid | x | x | x | x | x | x | x | x |
| stats | ||||||||
| Observations | 16,938 | 16,938 | 16,938 | 16,938 | 16,938 | 16,938 | 16,938 | 16,938 |
| R-squared | 0.386 | 0.311 | 0.262 | 0.294 | 0.386 | 0.311 | 0.262 | 0.294 |
| Significance levels: * p < 0.1, ** p < 0.05, *** p < 0.01. Format of coefficient cell: Coefficient (Std. Error) | ||||||||